
In this article, we will explore the particularities surrounding the offered interest rate and payment behaviour for personal loans in the context of data and graphs provided by analyzing a sample of all such loans that were processed by our software over a period spanning the last 1.5 years.
The sample comprises mixed portfolios across the whole Europe, including personal loans of all kinds (145,000+), such as car loans, real estate, and consumer loans. Portfolios with a mix of collateralized and non-collateralized loans, and borrowers of different genders and ages, from 18 to 89 years. Loan terms also varied greatly, from 1 month to 10 years.
Our analysis will provide insights into factors that influence interest rates and payment behaviour, and highlight the potential opportunities and challenges for lenders and borrowers in the personal loans market.
Interest Rates Relative to Loan Terms
From the chart below we can see how the difference between short-term loans, less than 6 months, and long-term loans, over 24 months was positive and in favor of long-term loans until it turned negative in May 2022.
One would expect the interest rate for long-term loans to be higher than short-term loans due to the extra risk, which is indeed usually the case. However, towards the end of 2021, the monetary policy forward guidance from central banks around the world started becoming hawkish.
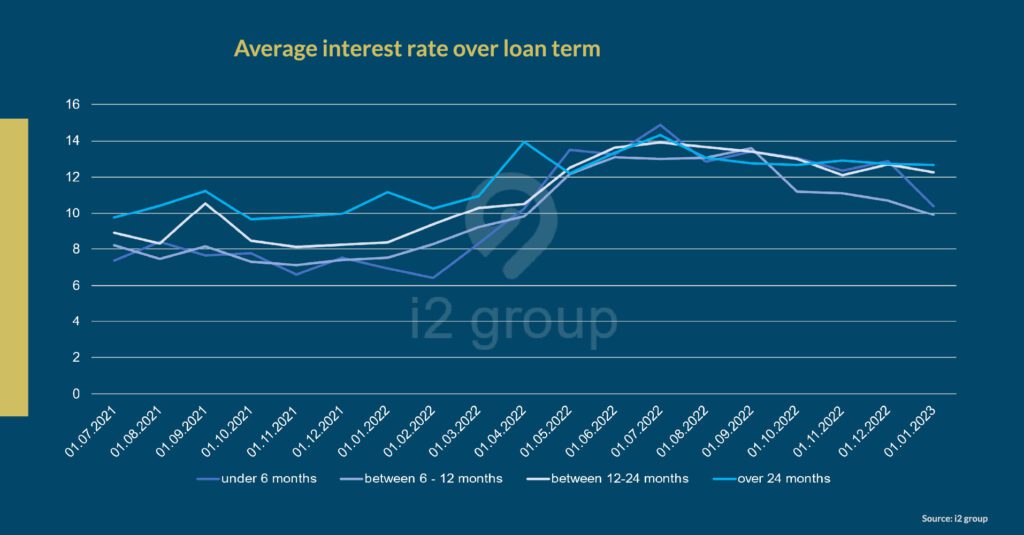
Add to that scenario the Ukraine war, and short-term interest rates, which factor in monetary policy and risk faster, started rising more than long-term interest rates. Eventually, most bond yield curves turned negative, with short-term interest rates higher than long-term.
The change in risk perception in the bond market carried over to lenders of personal loans. And by mid-2022, we can see that short-term interest rates stayed above or around par with long-term interest rates.
Interest Rates Compared to Age Groups
Until the beginning of 2022, interest rates on loans to the highest age group (70-89 years) were slightly lower than all the other younger age groups. However, that changed as central bank interest rates started rising and the Ukraine war began.
Perhaps, the new gap is due to an increase in the perceived risk from the older age group as lenders consider the likelihood of a recession as a consequence of monetary policy and the war in Europe. The extra premium on interest rates to the oldest age group persists and has even widened over the last months.
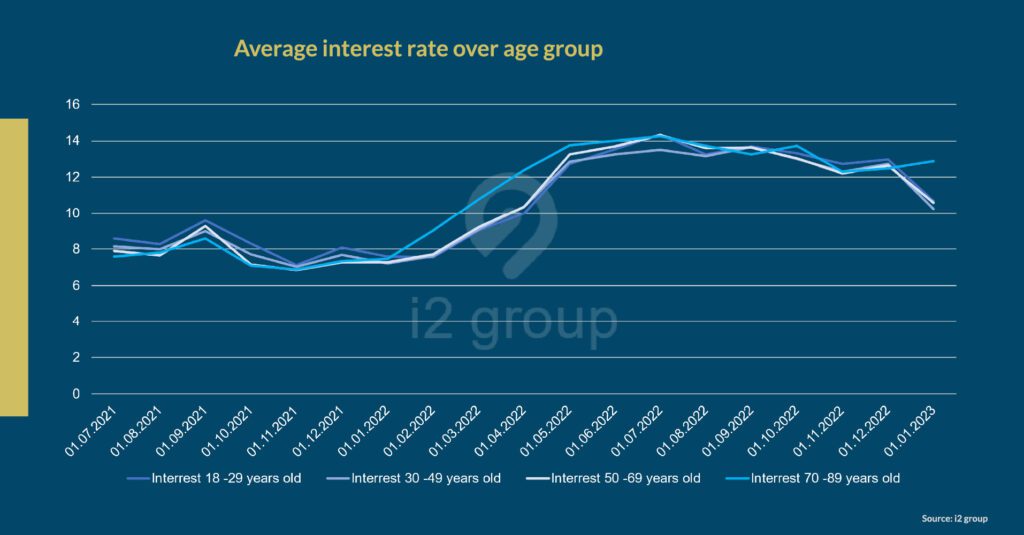
We can see in the chart above how interest rates for the oldest age group rose faster than any other group from the start of 2022 until the middle of the year. The proceeding half of 2022 saw the differences in interest rates between age groups diminish.
However, over the last month of data available, we see that the oldest age group is paying a premium over younger age groups. This may be due to the difficulty older people have in getting loans from banks, and their willingness to pay extra to secure the loan.
Delayed Payments Compared to Age Groups
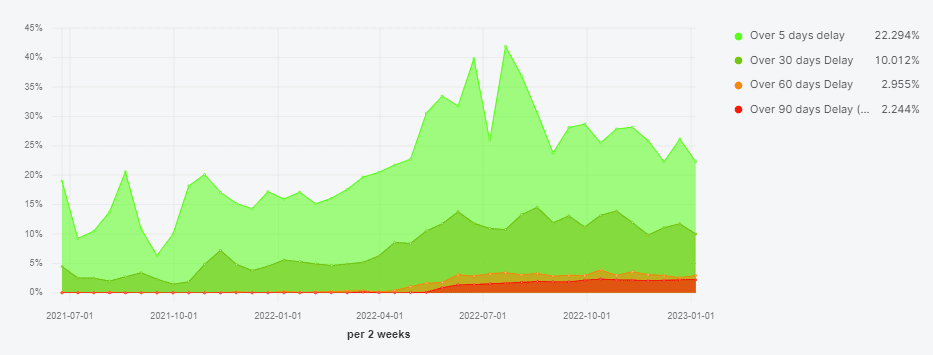
The charts below show the percentage of loans with delays for the 4 age groups seen in the charts above. We can see how the age group with the largest percentage of delay of over 90 days is the 18-29 years group.
Whereas the age group with the lowest percentage of delays is the 70-89 years group. Not only do they have a much smaller percentage of delays over 90 days, but they also have much lower percentages on the shorter delays.
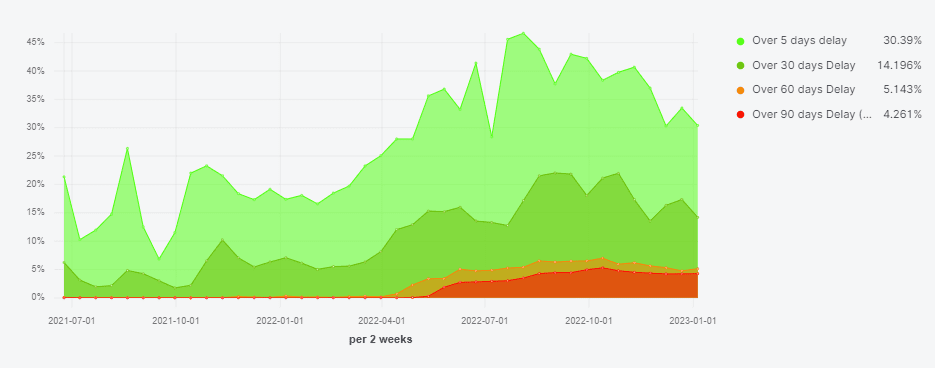
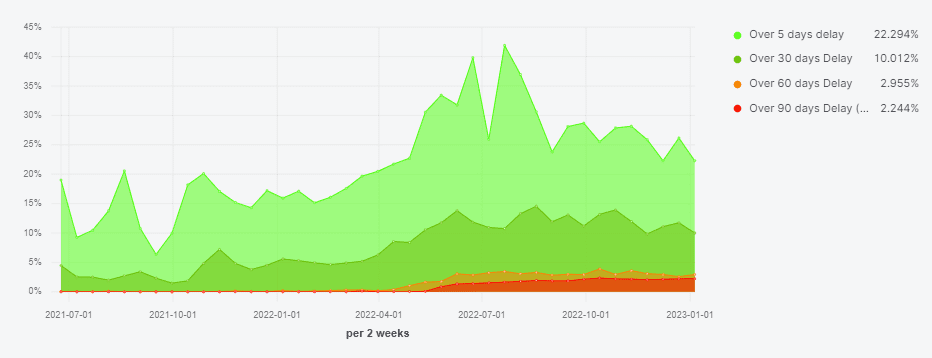
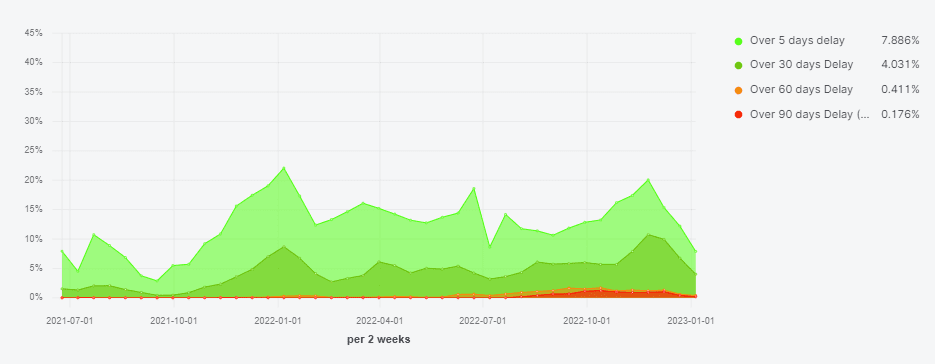
To put things into perspective, most banks will consider repayment delays of 90 days or more sufficient to classify loans as non-performing. This means action will be necessary to recover the funds, if they are recovered at all.
Conclusion
Our analysis of interest rates and payment behaviour for personal loans has shown that there are certain particularities that lenders and borrowers should be aware of. While the interest rates for long-term loans were usually higher than short-term loans, the scenario changed in 2021 and 2022, leading to higher interest rates for short-term loans.
This was a result of hawkish monetary policies and the Ukraine war. Furthermore, our analysis also revealed a mismatch in interest rates paid by the oldest age group (70-89 years) and their payment behavior.
Despite the higher perceived risk associated with this group, their delayed payment ratio was the lowest compared to all younger age groups. This creates an opportunity for lenders to receive higher income with less risk.
In light of these insights, we encourage lenders to consider focusing on the older age group as a viable lending segment. While this group may face difficulty in securing loans with traditional bank lenders, data suggests that they have a relatively high payment morale and are willing to pay a premium to secure a loan. This highlights an opportunity for non-traditional lenders to tap into this market and still offer loans at competitive interest rates.